Homework Assignments
HW08
- Problems:
-
HW08, [ 49K ], last updated November 30, 2017
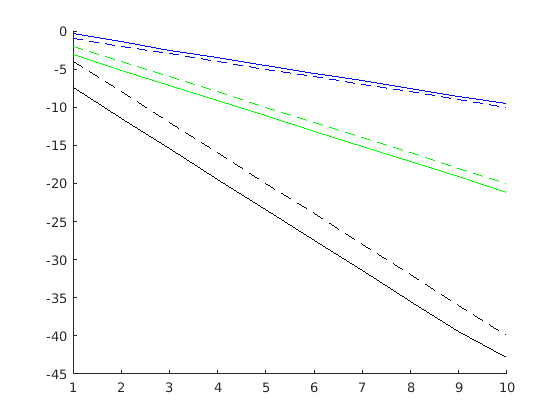
The graphs drawn in solid lines are Expected graphs of the absolute value of error in first derivative vs. inverse stepsize in double-logarithmic axis for different approximations of the derivative. Dotted lines are the graphs of \(y(h) = h^n\), \(n = 1, 2, 4\).
HW06
- Reading:
-
Cleve Moler, Zeroin, Part 1: Dekker’s Algorithm
- Reading:
-
Cleve Moler, Zeroin, Part 2: Brent’s Version
- Reading:
-
Cleve Moler, Zeroin, Part 3: MATLAB Zero Finder, FZERO
- Problems:
-
HW06, [ 38K ], last updated October 19, 2017
HW05
- Reading:
-
Effect of Roundoff Errors on the solution of a linear system of equations
- Problems:
-
HW05, [ 57K ], last updated October 10, 2017
HW02
- Git and Gitlab
-
Create a gitlab account on a UConn gitlab server
Install git, on your computer - Problems:
-
HW02, [ 59K ], last updated September 11, 2017
HW01
- Reading:
-
Cleve Moler, Introduction to MATLAB
- Matlab quick start:
-
Create a personal account with Matlab Academy (use your real name) and work through Matlab Onramp tutorial
- Problems:
-
HW01, [ 35K ], last updated August 29, 2017
Homework guidelines

Reproduced from http://www.sciencecartoonsplus.com