


Next: About this document
Up: Ultracold Collisions Observed in
Previous: Ultracold Collisions Observed in
References
- 1
-
A. H. Zewail, Faraday Discuss. Chem. Soc. 91, 207 (1991).
- 2
-
A. H. Zewail, J. Phys. Chem. 100, 12701 (1996).
- 3
-
R. H. Bowman, M. Dantus, and A. H. Zewail, Chem. Phys. Lett. 161, 297
(1989).
- 4
-
T. Baumert, M. Grosser, R. Thalweiser, and G. Gerber, Phys. Rev. Lett.
67, 3753 (1991).
- 5
-
T. J. Dunn, J. N. Sweetser, I. A. Walmsley, and C. Radzewicz, Phys. Rev. Lett.
70, 3388 (1993).
- 6
-
H. Stapelfeldt, E. Constant, and P. B. Corkum, Phys. Rev. Lett. 74, 3780
(1995).
- 7
-
U. Marvet and M. Dantus, Chem. Phys. Lett. 245, 393 (1995).
- 8
-
T. Sizer II and M. G. Raymer, Phys. Rev. Lett. 56, 123 (1986).
- 9
-
M. Machholm, A. Giusti-Suzor, and F. H. Mies, Phys. Rev. A 54, 5025
(1994).
- 10
-
H. M. J. M. Boesten, C. C. Tsai, B. J. Verhaar, and D. J. Heinzen, Phys. Rev.
Lett. 77, 5194 (1996).
- 11
-
D. S. Thomson, M. J. Renn, and T. F. Gallagher, Phys. Rev. Lett. 65, 65
(1990).
- 12
-
P. Julienne, A. M. Smith, and K. Burnett, Adv. At. Mol. Opt. Phys. 33,
141 (1993).
- 13
-
T. Walker and P. Feng, Adv. At. Mol. Opt. Phys. 34, 125 (1994).
- 14
-
J. Weiner, Adv. At. Mol. Opt. Phys. 35, 45 (1995).
- 15
-
K.-A. Suominen, J. Phys. B 29, 5981 (1996).
- 16
-
V. Sanchez-Villicana, S. D. Gensemer, and P. L. Gould, Phys. Rev. A 54,
R3730 (1996).
- 17
-
P. Julienne and J. Vigue, Phys. Rev. A 44, 4464 (1991).
- 18
-
P. L. DeVries and T. F. George, Mol. Phys. 36, 151 (1978).
- 19
-
E. L. Raab et al., Phys. Rev. Lett. 59, 2631 (1987).
- 20
-
C. D. Wallace, V. Sanchez-Villicana, T. P. Dinneen, and P. L. Gould, Phys. Rev.
Lett. 74, 1087 (1995).
- 21
-
C. D. Wallace et al., J. Opt. Soc. Am. B 11, 703 (1994).
- 22
-
C. J. Williams and P. S. Julienne, J. Chem. Phys. 101, 2634 (1994).
- 23
-
T. Walker and D. E. Pritchard, Laser Phys. 4, 1085 (1994).
- 24
-
L. Marcassa et al., Phys. Rev. Lett. 47, R4563 (1993).
- 25
-
P. D. Lett et al., J. Phys. B 28, 65 (1995).
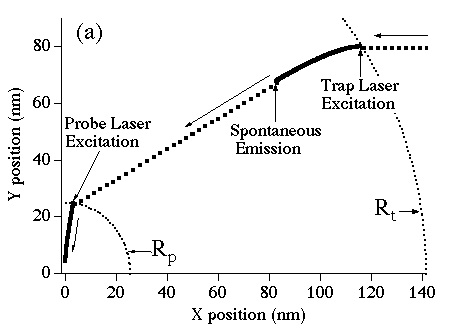
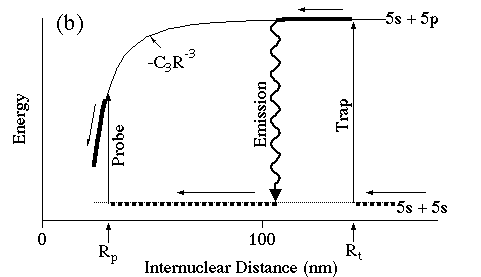
Figure 1: a) Typical classical trajectory of an atomic collision
showing the flux enhancement effect. The solid (dashed) line
indicates the atom's trajectory while in the excited (ground)
state.The incoming atom approaches from the right. The atom pair is
excited at  by the trap laser pulse and is accelerated by the
attractive long-range potential. After spontaneous decay, it
proceeds to
  , where it may be excited again by a probe laser
pulse. The atom pair is then accelerated quickly into short range,
where either RE or
  may occur, leading to trap loss. b)
Molecular potential diagram for the same process.
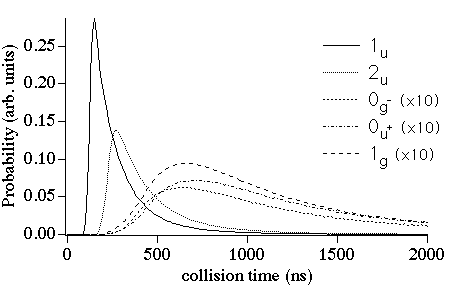
Figure 2: Classical simulations of time-resolved collisions
at  K. The trap (probe) laser intensity and
detuning are 15.2mW/cm
  (7W/cm
  ) and
) and  ,
respectively. The five curves are generated using the
C
  coefficients and excited-state lifetimes for each of the Hund's case (c)
attractive molecular states. Plotted is the probability for flux
enhancement to take place as a function of collision
time (i.e., time to travel from
  to
to  .)
.)
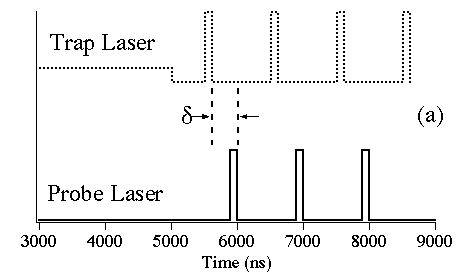
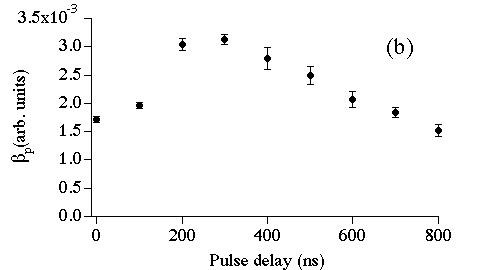
Figure: 3 (a) Timing of the trap and probe laser pulses for the
experiment. The trap laser is on at low (3.8mW/cm  ) intensity
for 5
  s. This is followed by a series of short (100ns),
intense (15.2mW/cm
  ) trap pulses. The probe pulses are 100ns
long and are peaked at time
  after the peak of each trap
pulse. The entire pattern repeats every
  s. (b)
  plotted as a function of
  . The flux enhancement effect
increases only after a delay of 200ns,
indicating a minimum collision time of
  . It then drops
off slowly, in reasonable agreement with the simulations (Figure
2.)
Steve Gensemer
Mon Dec 1 12:11:25 EST 1997