Laboratory #9: Sound Waves in a Rectangular Cavity (Again)
Objective:
This laboratory is quite similar to Lab#5, in which we found the modes of a rectangular cavity. However, this time, we want to display the cavity modes in a more general way. As before, we will play a sound file that sweeps in frequency from 0 Hz to 5,000 Hz, at a rate of 200 Hz/sec. While this is playing, the PASCO software will record the amplitude of the signal from the microphone. This will trace out all of the resonances of the cavity. To find the resonances, you will simply need to place the cursor at the peaks and record the values. To display the results, you will plot these frequencies as a function of 1/L, where L is the cavity length. Different types of modes will trace out different curves on this plot.
Equipment:
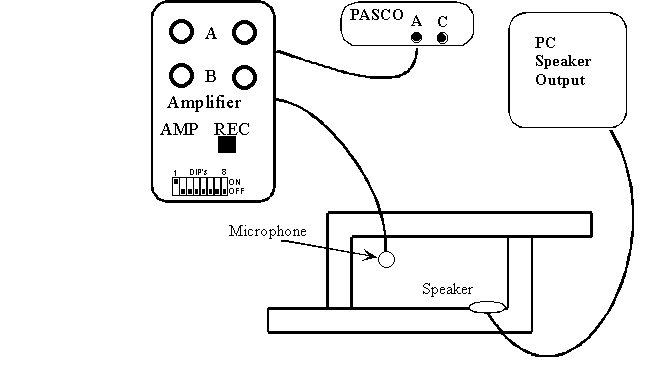
- Computer and PASCO software.
- Function generator.
- Speaker and microphone. Amplifier in REC setting.
- Plastic L's to form a rectangular cavity.
- Ruler.
Diagram:
Instructions:
- Start up PASCO software and open the file Lab9.sws.
- Open the Sound Player and open file Lab9.wav.
- Place the speaker and microphone as shown. Keep the microphone in one corner of the rectangle.
- To record the data, you click the record button in the PASCO window and then start the wave file. The PASCO program will not start recording until the wavefile starts. It will stop recording when the wavefile ends.
- With the cursor, record the time of each peak. To convert to frequency multiply by 200 Hz/sec. If the peaks are large in amplitude and do not have a sharp peak, repeat the scan at a lower volume because the peaks are saturated.
- Record resonances only up to 5,000 Hz.
- Repeat 5), 6) and 7) for cavity lengths of about 5, 7, 9.5, 13, 18, 25 cm. Then add as many more lengths as you can. The more lengths that you have the easier the next part will be.
- When you are done, plot the frequencies of all of the resonances as a function of 1/L.
- Try to group the frequencies by drawing straight lines through the origin or horizontal lines. You need at least five points to define a line. Also, a point needs to be within one box to be on a line.
DATA:
Cavity length =
Cavity length =
Cavity length =
Cavity length =
Cavity length =
Cavity length =
Cavity length =
Cavity length =
Cavity length =

Questions:
- Certain frequencies do not change as a function of L. What series do these frequencies correspond to?
- Certain frequencies do change and, in fact, lie on lines through the origin. Why are the lines straight and why they go through the origin?
- From your answers to 1) and 2) label the lines on the graph.
- Some measured frequencies are not accounted for. What modes do these correspond to?